Consumer Research
Consumer Research offers several products to fit your specific needs, including
Consumer ViewSM 800 Consumer ViewSM
Online Consumer ViewSM Sales Enhancer
Image WaveSM studies Consumer Needs AnalysisSM
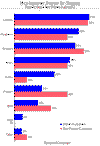
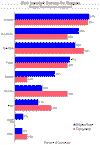
How well do you know your customers? Are their needs changing? What do you really know about your competition? Consumer View measures virtually every department of every competitor and provides detailed consumer and customer perceptions, showing you how well you’re meeting your customers’ needs and where you could improve. Knowing the strengths and weaknesses of your competition, you can leverage your strengths against your competition’s weaknesses.
Our Consumer View provides consumer sensitivities, images and customer demographics for every major competitor. This helps determine what market positions are serviceable and where the competition is vulnerable. Virtually all of this information can be compared to previous surveys to demonstrate trends and market changes.
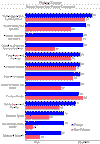
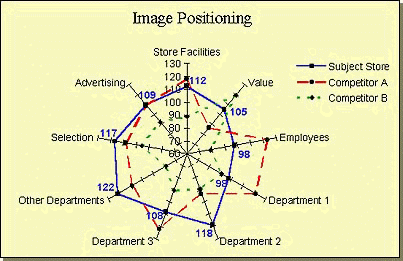
How do consumers feel about your store’s prices? Its service? What about the quality of the products? The image positioning chart shown below compares the images of your store with the competition in several key attributes. If your store encircles the competition in all image categories, your store is perceived as the leader in every area.
Do you ever wish you could hear more direct feedback from your customers? Our 800 Consumer ViewSM survey invites your customers to call a toll-free number and complete an automated telephone survey. Your voice greets them and asks for their comments and suggestions. One of the main features of this type of survey is the voice recordings of your customers’ comments. These comments are very informative and useful when implementing changes at store level.
These are very cost-effective surveys because we use a Totally Automated Telephone Interviewing system (TATI). We have developed several pre-designed surveys directed at different types of retail stores. We also survey employee attitudes and consumer perceptions. Virtually any retailing issue can be targeted, and customized surveys are our specialty.
An 800 Consumer ViewSM survey provides a quick and inexpensive way to get feedback. This type of survey can be used at a store’s Grand Opening to gather customer opinions and suggestions for improvement. As a follow-up to a more extensive survey, it can be used to focus on problem areas or to gather additional data prior to implementing changes.
800 Consumer ViewSM Capabilities:
-
Automated Interviewing:
-
Consumer Receives Invitation to Participate
-
Calls 800 Number
-
Personal Message from Company Representative
-
Touch-tone Answers and Verbal Responses
-
-
Real Time Feedback
-
Convenient for Consumers – 24 Hours a Day, 7 Days a Week
-
Tabulation/Graphics of Responses
-
Cassette Tape of Comments
800 Consumer ViewSM Applications
-
Customer Satisfaction
-
Client Feedback
-
Product Quality Tracking
-
Data Collection
-
Warranty Registration
-
Attitude Measurement
800 Consumer ViewSM Advantages
-
Fast Turnaround
-
Cost Effective
-
Spontaneous/Well Focused Comments
-
Timely
-
Actionable
Progressive Grocer’s Annual Survey shows that the average primary customer outspends his or her non-primary counterpart by $32 per week. Therefore, by increasing the satisfaction level of customers who already visit your store, you can convert non-primary customers into primary customers, thus gaining as much as $1,664 in annual revenue for each customer you convert!

As the chart above illustrates, a conversion of just 50 customers could generate $83,200 in additional sales per store in a year. Even if you have a predominance of primary customers, think what an additional dollar per shopping trip from each of them would add to your sales.
At Dakota Worldwide, we have developed a system called 800 Consumer ViewSM Sales Enhancer, designed to increase store sales from both primary and secondary customers. The heart of this program is an examination of your customers’ satisfaction, which allows you to identify and improve upon your stores’ perceived weaknesses and to capitalize on the stores’ perceived strengths.
We are offering you the opportunity to establish your ongoing 800 Consumer ViewSM Sales Enhancer program for your stores. Dakota Worldwide will interview your existing customers through an automated inbound telephone survey. We will conduct 200 interviews, per store, for at least your top and bottom five stores semi-annually, with a report based on the level of analysis desired.
We can perform this project for as low as $749 per store, with a 10-store minimum. For instance, a 10-store study would cost a total of $7,490 semi-annually. Just compare this price to a traditional inbound telephone survey which, at $3,000+ per store, can cost from $30,000 for the same 10 stores! Scroll down for complete details, pricing and features available for this offer.
We would like to get started on this project for your stores. Use this valuable and affordable system to increase your sales dramatically.
Affordable Internet Surveys
Looking for an online survey service? Online surveys are a snap with Consumer ViewSM Online.
You can now survey your customers, employees, or the general public for a fraction of a traditional telephone or mail survey. For example, a traditional inbound telephone survey can cost from $3,000 to $6,000. The same survey, done over the web, can cost as low as $799!
In addition, you can survey multiple stores at a much lower cost, since there is only the original setup fee per project.
 Consumer ViewSM Online invites your customers to visit an anonymous website and complete an automated online survey. We provide either e-mail or printed invitations, which your store personnel use to invite customer participation. Then, when customers visit the survey website, your message greets them (voice or text) and asks for their comments and suggestions.
Upon completing the interview, the customer is given a code number which creates a coupon from the invitation. The coupon is for a Free Item (a dozen eggs works extremely well), which brings the customer through your store an additional time.
The online survey process
-
Consumer receives invitation to participate by either e-mail or in person by store/office personnel
-
Consumer visits the survey’s web page
-
Personal introduction from Company Representative
-
Consumer completes survey; receives reward code
-
Consumer takes reward code to store/office
-
Dakota Worldwide tabulates and reports on survey findings
Capabilities
-
Real Time Feedback
-
Convenient for Consumers – 24 Hours a Day, 7 Days a Week
-
Tabulation/Graphics of Responses
-
Online Tracking of Responses and Comments
Advantages
-
Fast Turnaround
-
Cost Effective
-
Spontaneous/Well Focused Comments
-
Timely
-
Actionable
Other Applications
-
Customer Satisfaction
-
Employee Evaluation and Satisfaction
-
Client Feedback
-
Product Quality Tracking
-
Data Collection
-
Warranty Registration
-
Attitude Measurement
Pricing
The basis of analysis desired determines the cost and detail of each report (per site) provided. The following table describes the cost per level of detail:
Project Options Cost ($)
- Top-line data, tables and charts $799*
- Custom Crosstabs, Report & Analysis Ask for Quote
*The $799-per-store price is based on our standard questionnaires, tables and charts. Call for additional pricing if interested in more detailed reports, including management summary, statistical analysis and detailed individual-store reports.
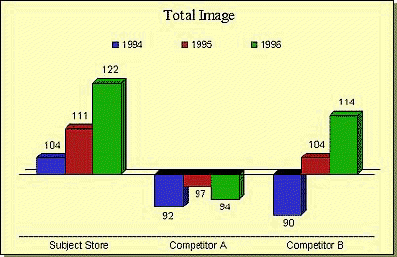
Our Image Wave survey measures changes over time in basic market shares and department/category images. It is a quick and cost-effective method to show a chain’s or an individual store’s market position relative to its competition. The survey is based on our Consumer View SM format is often used to cover multiple locations or as a follow-up to previous research.
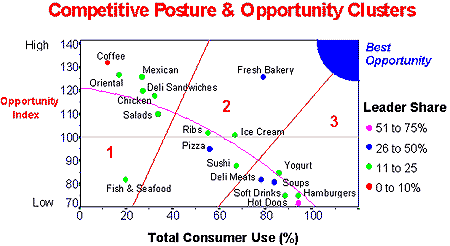
How can you break into the growing market for prepared foods? Consumer Needs research can help you minimize the risk. We can help you assess market potential, identify customer profiles, learn more about your competition and evaluate opportunities to attract and retain customers by providing what consumers want. Consumer Needs research can also help you determine the best approach for increasing sales in food service and prepared foods.
A Consumer Needs assessment quantifies the relationships between consumer demand for new products, the strengths and convenience of the competition, and the likelihood of success in bringing a new product to the market. The chart below illustrates how well consumer needs for various products are being met by the competition. Product categories are measured with regard to overall consumer use, competitive market share and consumer satisfaction. The resulting “opportunity clusters” are then analyzed to identify areas of unmet consumer demand. This analysis helps determine which new products fit best with a store’s current market position and what the best strategies may be to compete effectively in those areas.
