Quintillion
The Ultimate Decision Support System
Quintillion 4.50 is a Decision Support and Executive Information System allowing you to manage and analyze all your company data. In this section you will find detailed specifications, a downloadable version of the Animated Quintillion Demo and the online Quintillion Demonstration.
Download the Animated Quintillion Demo
View the Quintillion Market Map
(showing Quintillion’s seamless coverage of the United States)
Download the MapInfo5.5 Patch
Download the Revised Quintillion Support files July15
Download the Revised Quintillion Support file #2 July15
Quintillion was developed to automate the evaluation of market potential, market opportunities, store performance, trade area delineation and market promotions.
Quintillion 4.50 can be used as:
- a general delivery tool to display mapping information across an enterprise.
- a well-focused Executive Information System (EIS) tool customized for a specific group of executives.
- a site location tool to help you find those hard to get locations.
- an advertising and promotion manager.
- a micro planner.
- a frequent shopper administrator.
Quintillion 4.50 also provides access to a variety of information sources:
- Maps
- Photographs
- Video
- Sound
- CAD Drawings
- Business or Scientific Charts
- Satellite Imagery
- ASCII Files
- dBase
- Lotus
- Excel
History
Quintillion was initially developed by the McDonald’s Corporation to automate the evaluation of market potential, market opportunities, store performance, trade area delineation and market promotions. In 1994, Dakota Marketing obtained ownership of Quintillion. Impressed and excited about the potential of this product, Dakota Worldwide has moved Quintillion from a workstation to the PC platform, thus significantly reducing its cost.

Data from many sources is integrated within Quintillion.
Output can be to your printer or to your screen for presentations.
Today, Quintillion opens the window to a variety of information sources, such as Maps, Photographs, Video, Sound Clips, CAD Drawings, Business or Scientific Charts, Satellite Imagery, ASCII files, dBASE, Lotus, Excel and any database server supported by QELIB or ODBC (Oracle, Sybase, etc.).
Information delivery
The Quintillion system is comprised of three programs, Quintillion VDB, the Map Administrator and MapInfo®. With these three applications you can begin analyzing any market within the United States or build your own custom markets.
Through the support of the Map Administrator, information recall and data analysis is as easy as point and click. The standard Quintillion interface provides you with a business mapping tool via MapInfo®, and access to analysis tools. Multimedia features such as photos, videos, audio recordings, data files or other historical data regarding your market can be accessed by the system.
Uses of Quintillion
1. Displaying business and demographic information across an enterprise.
2. A well-focused Executive Information System (EIS) tool customized for a specific group of executives.
3. A Site Location tool to help you find those hard to get locations.
4. An Advertising and Promotion Manager.
5. A Micromarketing Planner.
6. A Frequent Shopper Administrator.
7. Visually analyze the profitability of sales for territories, market areas or trade areas. Review market potential down to the block group level. Understand visually where best to locate a particular type of store or retail format. Place competitive evaluations in the hands of upper management.
Available Markets
One hundred sixty seven prepackaged markets provide a complete coverage of the continental United States, Alaska and Hawaii. Each market is offered in economy or standard revisions.
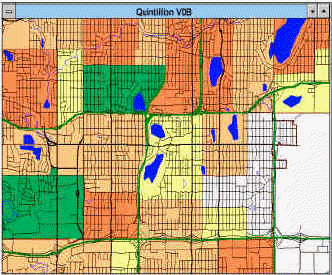
Map Features
- Interstate Highways
- Streets
- Major Roads
- Railroads
- Streams and Shoreline
- Airports
- Landmarks: Parks, Military Bases, etc.
- Water Fill: Lakes, Rivers and Oceans
- Congressional Districts
- School Districts
- Minor Civil Divisions
- Census Tracts
- Census Block Groups
- Municipal Boundaries
- County Boundaries
- Market Summary
- All Economy Features
Market Summary
In addition to the map features, economy markets are delivered with 2003 Demographics for Census Tracts, Municipal Boundaries, County Boundaries and the Market Summary. Standard markets include your choice of current demographics from either Claritas or CACI. Current demographics are provided for Census Block Groups, Census Tracts, County Boundaries and the Market Summary. Other data sets containing consumer expenditures, lifestyles, traffic counts, etc…, can be delivered on request. Your own corporate data, such as customer addresses, can be integrated by your own staff or our support service.
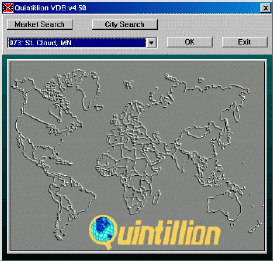 Quintillion is also designed to provide immediate access to multiple markets. These markets can be activated from a pick list or by pointing to the appropriate area on the reference page.
The development of Quintillion for Windows was reviewed by top executives in the banking, manufacturing, real estate and retail industries. This process has resulted in a system that can be used by the casual user while also meeting the needs of the technically demanding professional.
Display Types
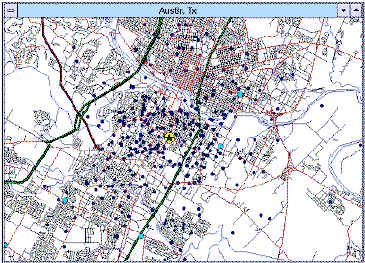
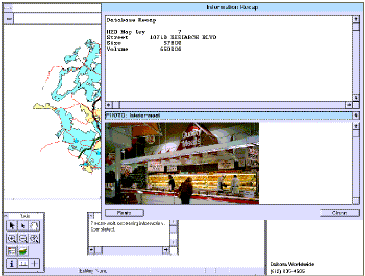
Quintillion also allows you the use of Maps, Business or Scientific Charts, Photographs, Textual Reports, CAD Drawings, Demographic Signatures and Video Clips to help you during your studies and/or presentations. Below are two screen examples showing customer spottings, recorded video clips and database results.
System Functionality
|
|
Quintillion will grow with your organization. Additional tools are available for reviewing signatures, creation of demographic indexes, trade zones, etc. Custom tools can be developed to meet your organization’s unique demands.
Additional Tools
Signatures
This feature of the Quintillion analysis system is designed to help you to identify trade area profiles based on your successful facilities. While it’s true that each store within the market will have its own signature, the trade area of successful stores will be similar. By identifying the signature of successful stores, you can more effectively target your marketing dollars by focusing your efforts on the trade area profile which indicates a strong likelihood of success.
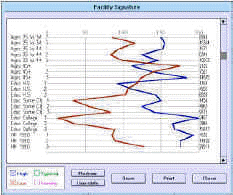 Signatures provide a means of visually comparing store environments. The sample screen on the right compares the tell-tale demographic signature of high volume stores with the demographic signature of low volume stores.
 Expand the understanding and impact of a ring study for a potential site by exposing the demographic signature of the proposed trade area.
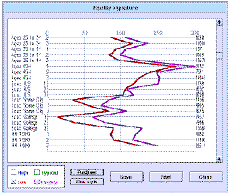 This signature serves as an indicator of the expected sales performance of the proposed site. Additionally, it suggests that this site would fall in the range of the low volume stores in this market.
Frequent Shopper Tool
The Frequent Shopper Tool is currently being used by major retail chains to keep track of who their primary customers are, where do they live and how often they visit a particular store. This tool is often linked to internal data such as customer shopping patterns and shopping frequency. For example, the Frequent Shopper Tool can tell you if a primary customer has failed to visit your store in the last eight weeks. So, you may decide to send this customer a coupon flyer to improve your image and retain his loyalty. This tool also shows customer cluster patterns. So, if a cluster of primary customers in a particular neighborhood stop visiting the store, this may indicate that either a new competitor opened a store, or a primary access road has been closed.
Targeting Index
The Targeting Index is a tool that exposes high concentrations of a desired customer profile. The results of this analysis can then be used for site review, promotions and operational strategies. For example, with this tool you will be able to apply the characteristics of a warehouse shopper to develop marketing programs for increasing your market share.
Proximity Report
A Proximity Report lists the distance and direction from a specific location to surrounding businesses which may complement your activities or show increased competition. This is critical to site evaluations as it indicates the proximity of your site to existing businesses which will influence your sales volume and thereby your bottom line. Types of businesses include such facilities as competitors, schools and churches.
Trade Zones
The Trade Zone utility may be used to establish “Zones of Influence” around individual stores, groups of stores, or an entire store network. The “Zones of Influence” geographically show the coverage of each store or store network and visually expose gaps in your marketplace, allow for zone pricing and can help select direct mail zones.
Impact
The Impact model investigates the effect a new facility will have on the sales of existing stores within your network. The results of the model can help a retailer determine new trade areas and minimize the risk of impairing sales performance at existing corporate stores or franchises.
The Quintillion Market Map
 Each of the 167 pre-packaged markets provide complete coverage of the continental United States, Alaska and Hawaii. The user selects the number of markets he/she is interested in, and we deliver them along with the Quintillion software.
In addition, we now provide customized markets, such as a nationwide market containing 2003 demographic information at the county level. Each market is offered in economy and standard versions.
To view, simply click on the thumbnail above. You may also view the full market list in the next section.
